Content Index
The log plays a primary role in keeping records of possible problems that are occurring in the application for later identification and resolution of errors, usually locally, we use the debug tool, along with the dd() function to be able to clearly see the errors per screen, but, for production something more elegant is used, such as the use of logs, which is the topic we will cover in this section.
Why are they vital?
You can't rely on a user to report an error, much less provide technical details. Regularly reviewing logs (via FTP or SSH) allows you to:
- Identify broken URLs that affect SEO.
- Detect database update errors.
- Correct logic errors that only occur with certain real customer data.
Log records can be generated from errors that occur in the application or methods used by ourselves as we will see in this section. In addition, we can customize the log processes either to record errors in the framework.
In Laravel, logs are configured through channels such as files or database.
The first thing we are going to do is cause some error in the project, for example:
app\Http\Controllers\Dashboard\PostController.php
$posts = Post::paginat(10);Automatically, if we go to the route the controller processes, we will see the error on the screen:
http://larafirststeps.test/dashboard/post
Call to undefined method App\Models\Post::paginat()In production, we should not leave this type of messages enabled to avoid exposing critical parts of the system to unauthorized users. It is recommended to store these errors in a system log; to enable it, we first deactivate the project's debug mode:
.env
APP_DEBUG=falseAnd now we would see a 500 error in the path of:
http://larafirststeps.test/dashboard/post
Configure channels for the log
Now let's see the configuration file for the log:
config\logging.php
'default' => env('LOG_CHANNEL', 'stack'),By default it uses the stack configuration.
If we analyze the log configuration file, we see the possible channels that we can use:
config\logging.php
'channels' => [
    'stack' => [
        'driver' => 'stack',
        'channels' => explode(',',env('LOG_STACK', 'single')),
        'ignore_exceptions' => false,
    ],
    'single' => [
        'driver' => 'single',
        'path' => storage_path('logs/laravel.log'),
        'level' => env('LOG_LEVEL', 'debug'),
        'replace_placeholders' => true,
    ],
    'daily' => [
        'driver' => 'daily',
        'path' => storage_path('logs/laravel.log'),
        'level' => env('LOG_LEVEL', 'debug'),
        'days' => env('LOG_DAILY_DAYS', 14),
        'replace_placeholders' => true,
    ],
];
Default channels
As you can see in the previous file, there are several log channels that you can use for different purposes:
- Single channel, logs all messages in a single log file specified in the configuration. It is useful for local development or when you need a simple log file without log rotation.
- Daily channel, records messages in a new log file every day, this prevents the log file from growing too much as in the previous case, therefore, this is the preferred one for when we have the application in production.
- Slack Channel, is a Monolog handler based on SlackWebhookHandler.
- Syslog channel, sends log messages to the system syslog service.
- errorLog channel, logs messages to the PHP error log, which is system-specific.
- Custom channel, personalized log that will allow messages to be recorded in any location.
Each of the channels has various forms of configuration such as the path to store the file:
'path' => storage_path('logs/laravel.log'),Or the level you will listen to:
'level' => env('LOG_LEVEL', 'debug'),Which we will talk about a little later.
The driver where the simplest is single, to indicate a file:
'single' => [
    'driver' => 'single',
    'path' => storage_path('logs/laravel.log'),
    'level' => env('LOG_LEVEL', 'debug'),
    'replace_placeholders' => true,
],
Although we can also create our own logs as follows:
config\logging.php
'custom' => [
            'driver' => 'single',
            'path' => storage_path('logs/custom.log'),
            'level' => 'debug'
        ]
The type of log that would serve us in most cases would be single (or daily in production), and from time to time we review the log to correct possible problems in the system.
To see the previous error in the log, configure the driver with:
config\logging.php
'default' => env('LOG_CHANNEL', 'single'),When you reload the page with the error, you should see a log file generated in:
config\logging.php
Log Levels
The log level provides an outline of all the log levels defined in the RFC 5424 specification. In descending order of severity, these log levels are: emergency, alert, critical, error, warning, notice, info, and debug.
- "emergency": The system cannot be used.
- "alert": Action must be taken immediately.
- "critical": Critical conditions.
- "error": Runtime errors that do not require immediate action.
- "warning": Exceptional events that are not errors.
- "notice": Normal but significant events.
- "info": Events or interesting information.
- "debug": Debugging information.
That is, an error type level has more weight or importance than the warning level according to the scale presented before, and this is important since with the log level option, we can specify up to what level we want to record.
From the application, we can register our own logs in the following way in which we have a method for each level of the log:
Log::emergency($message);
Log::alert($message);
Log::critical($message);
Log::error($message);
Log::warning($message);
Log::notice($message);
Log::info($message);
Log::debug($message);
Log formatter
We can create a format for the logs like the following:
app/Logging/CustomFormatter.php
<?php
namespace App\Logging;
use Monolog\Formatter\LineFormatter;
class CustomFormatter{
    public function __invoke($logger)
    {
        foreach ($logger->getHandlers() as $handle) {
            $handle->setFormatter(new LineFormatter("(%datetime%) - %message%\n"),null,true,true);
        }
    }
}
The parameters of the setFormatter() method correspond:
- $format: Defines the format of the log line. You can use placeholders like %datetime%, %channel%, %level_name%, %message%, %context%, %extra%, etc.
- $dateFormat: Defines the format of the date and time in the record.
- $allowInlineLineBreaks: Whether or not to allow inline line breaks.
- $ignoreEmptyContextAndExtra: Whether to ignore empty contexts and extras (boolean value).
- $includeStacktraces: Whether to include stack traces in the log (boolean value).
It is possible to customize aspects such as those shown in this example:
<?php

namespace App\Logging;

use Illuminate\Log\Logger;
use Monolog\Formatter\LineFormatter;

class CustomizeFormatter
{
    public function __invoke(Logger $logger): void
    {
        foreach ($logger->getHandlers() as $handler) {
            $handler->setFormatter(new LineFormatter(
                '[%datetime%] %channel%.%level_name%: %message% %context% %extra%'
            ));
        }
    }
}
You can get more information at:
https://laravel.com/docs/master/logging
And we register the formatter in the channel we are using, in our example, the single one:
config\logging.php
'single' => [
    ***
    'tap' => [App\Logging\CustomLogging::class],
],
From now on, every time a record is generated in the log, it will be done with the previous format.
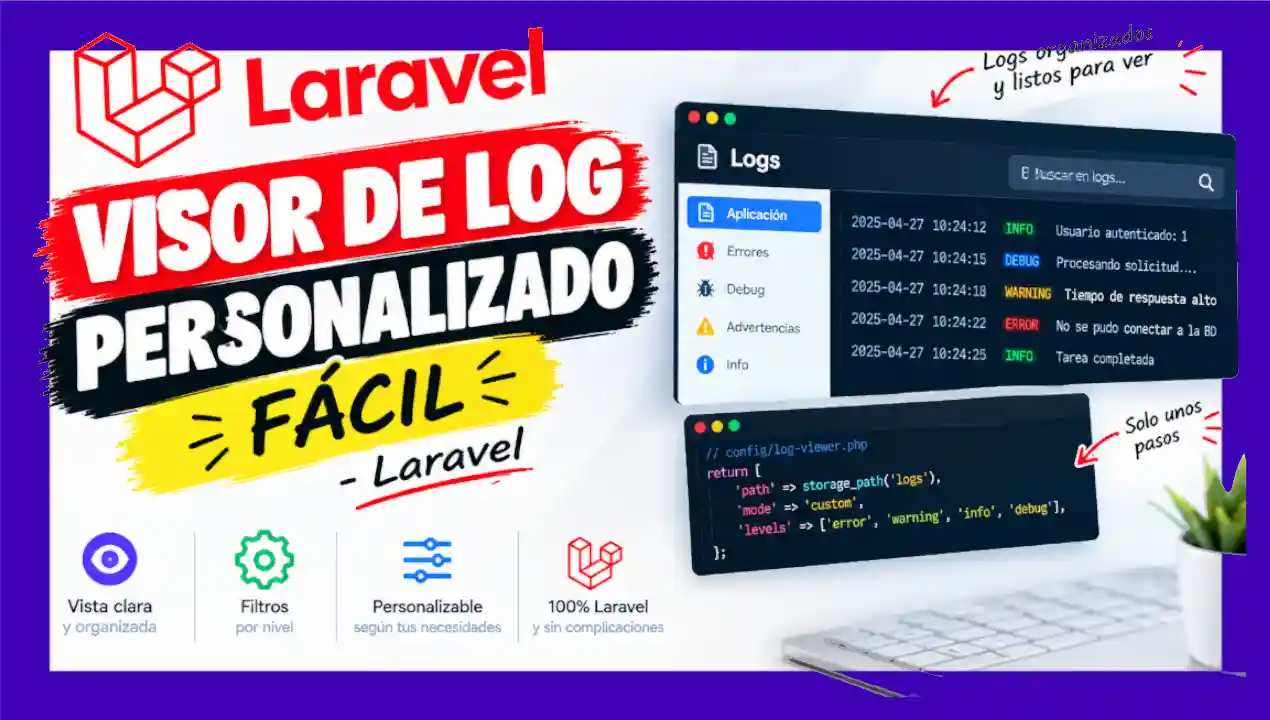
Implementation of a Custom Log Viewer with Livewire
Although log generation is automatic, querying logs directly on production servers can be cumbersome if you rely exclusively on SSH connections or SFTP tools (such as FileZilla) to manually download and read the files.
While several third-party and paid packages exist within the ecosystem, building a simplified internal log viewer directly inside your own administration panel is a lightweight and efficient alternative that avoids adding non-essential external dependencies to your composer.json file.
Through a Livewire component, it is possible to structure an interactive log viewer that filters entries by severity level, enables keyword searching within messages, and provides quick actions to clear the log file.
The core of this solution lies in processing the laravel.log file using regular expressions to parse raw plain-text lines into a structured dataset:
<?php

use Livewire\Attributes\Title;
use Livewire\Component;
use Illuminate\Support\Facades\File;

new #[Title('Log Viewer')]
    class extends Component {
    public string $search = '';
    public string $level = 'ALL';
    public int $maxLines = 200;

    /**
     * Retrieves and parses log entries.
     */
    public function getLogsProperty(): array
    {
        $logPath = storage_path('logs/laravel.log');

        if (!File::exists($logPath)) {
            return [];
        }

        $content = File::get($logPath);
        if (empty(trim($content))) {
            return [];
        }

        $pattern = '/^\[(\d{4}-\d{2}-\d{2}[T ]\d{2}:\d{2}:\d{2}.*?)\]\s+([a-zA-Z0-9_\-\.]+)\.([A-Z]+):\s+(.*?)(?=\n\[\d{4}-\d{2}-\d{2}|\z)/ms';
        preg_match_all($pattern, $content, $matches, PREG_SET_ORDER);
        // dd($matches);
        $parsedLogs = [];

        foreach (array_reverse($matches) as $match) {
            $date = $match[1] ?? '';
            $env = $match[2] ?? '';
            $logLevel = strtoupper($match[3] ?? 'INFO');
            $message = trim($match[4] ?? '');

            if ($this->level !== 'ALL' && $logLevel !== $this->level) {
                continue;
            }

            if (!empty($this->search)) {
                $searchLower = strtolower($this->search);
                if (!str_contains(strtolower($message), $searchLower) && !str_contains(strtolower($date), $searchLower)) {
                    continue;
                }
            }

            $parsedLogs[] = [
                'date' => $date,
                'env' => $env,
                'level' => $logLevel,
                'message' => $message,
            ];

            // dd($parsedLogs);

            if (count($parsedLogs) >= $this->maxLines) {
                break;
            }
        }

        return $parsedLogs;
    }

    public function deleteLogFile(): void
    {
        $logPath = storage_path('logs/laravel.log');

        if (File::exists($logPath)) {
            File::delete($logPath);
            Flux::toast('The laravel.log file was deleted from disk.');
        }
    }

    /**
     * Clears the laravel.log file
     */
    public function clearLog(): void
    {
        $logPath = storage_path('logs/laravel.log');

        if (File::exists($logPath)) {
            File::put($logPath, '');
            Flux::toast('The laravel.log file has been emptied.');
        }
    }

    public function with(): array
    {
        return [
            'logs' => $this->logs,
        ];
    }

    public function rendering($view, $data): void
    {
        $view->title('Log Viewer');
    }
}
?>
Blade Component Structure
In the associated view, the formatted data is rendered using Blade directives, applying styles based on record severity (for instance, red badges for critical errors and yellow badges for warnings):
<div class="space-y-6">
    <div class="flex justify-between items-center">
        <div>
            <flux:heading level="2">Log Viewer</flux:heading>
            <flux:subheading>Inspect and monitor storage/logs/laravel.log in real time</flux:subheading>
        </div>

        <div class="flex items-center gap-2">
            <flux:button wire:click="$refresh" icon="arrow-path" size="sm">
                Refresh
            </flux:button>
            <flux:button wire:click="clearLog" wire:confirm="Are you sure you want to clear the log file?" icon="trash"
                variant="danger" size="sm">
                Clear Log
            </flux:button>
        </div>
    </div>

    <flux:card class="space-y-4">
        <div class="flex flex-row gap-4">
            <div>
                <flux:field>
                    <flux:label>Search in log</flux:label>
                    <flux:input wire:model.live.debounce.300ms="search"
                        placeholder="Search errors, SQL queries, or 'ld.'..." icon="magnifying-glass" clearable />
                </flux:field>
            </div>

            <div>
                <flux:field>
                    <flux:label>Log Level</flux:label>
                    <flux:select wire:model.live="level">
                        <flux:select.option value="ALL">All Levels</flux:select.option>
                        <flux:select.option value="ERROR">ERROR</flux:select.option>
                        <flux:select.option value="WARNING">WARNING</flux:select.option>
                        <flux:select.option value="INFO">INFO</flux:select.option>
                        <flux:select.option value="DEBUG">DEBUG</flux:select.option>
                        <flux:select.option value="CRITICAL">CRITICAL</flux:select.option>
                    </flux:select>
                </flux:field>
            </div>
            <div>
                <flux:field>
                    <flux:label>Clear Log</flux:label>
                    <flux:button wire:click="clearLog"
                        wire:confirm="Are you sure you want to clear the log file?" icon="trash"
                        variant="danger" size="sm">
                        Clear Log
                    </flux:button>
                </flux:field>
            </div>
        </div>
    </flux:card>

    <div
        class="overflow-hidden bg-zinc-950 text-zinc-100 rounded-xl border border-zinc-800 shadow-2xl font-mono text-xs">
        <div class="flex items-center justify-between px-4 py-2 border-b border-zinc-800 bg-zinc-900/80 text-zinc-400">
            <span class="flex items-center gap-2">
                <span class="inline-block w-2.5 h-2.5 rounded-full bg-emerald-500 animate-pulse"></span>
                storage/logs/laravel.log
            </span>
            <span>Showing latest {{ count($logs) }} entries</span>
        </div>

        <div class="p-4 overflow-y-auto max-h-[650px] space-y-3 divide-y divide-zinc-900">
            @forelse($logs as $log)
                <div class="pt-3 first:pt-0 space-y-1">
                    <div class="flex flex-wrap items-center gap-2">
                        <span class="text-zinc-500">[{{ $log['date'] }}]</span>
                        <span
                            class="px-1.5 py-0.5 rounded text-[10px] font-bold uppercase tracking-wider
                                                                                                    @if($log['level'] === 'ERROR' || $log['level'] === 'CRITICAL') bg-red-500/20 text-red-400 border border-red-500/30
                                                                                                    @elseif($log['level'] === 'WARNING') bg-amber-500/20 text-amber-400 border border-amber-500/30
                                                                                                    @elseif($log['level'] === 'INFO') bg-blue-500/20 text-blue-400 border border-blue-500/30
                                                                                                    @else bg-zinc-800 text-zinc-400 @endif">
                            {{ $log['level'] }}
                        </span>
                        <span class="text-zinc-400 text-[11px]">env: {{ $log['env'] }}</span>
                    </div>

                    <pre
                        class="p-2 rounded bg-zinc-900/50 text-zinc-300 overflow-x-auto whitespace-pre-wrap break-words leading-relaxed">{{ $log['message'] }}</pre>
                </div>
            @empty
                <div class="py-12 text-center text-zinc-500">
                    No log entries were found.
                </div>
            @endforelse
        </div>
    </div>
</div>
Importance of Continuous Monitoring
Regularly reviewing log files is a fundamental practice in the maintenance phase of any project. It is highly recommended to audit logs with special attention after releasing new deployments or production updates.
Having an integrated viewer within your admin dashboard streamlines this workflow, allowing you to catch unhandled exceptions, performance bottlenecks, and business logic inconsistencies early on—directly within the application itself.