Content Index
- What is Laravel Debugbar and what is it really for?
- When to use it and when to avoid it
- How to install Laravel Debugbar step by step
- How to correctly enable or disable Laravel Debugbar
- Enable or disable from code
- Generated files and initial behavior after installation
- Best practices to avoid uploading Debugbar to production
- Key sections of Laravel Debugbar
- Practical use examples (real development cases)
- Frequently Asked Questions about Laravel Debugbar (FAQ)
- Conclusion
If you develop with Laravel, sooner or later you'll find yourself reviewing queries, measuring timings, chasing down an N+1, trying to understand what's happening in the background, or simply wanting to see every single CRUD operation in Eloquent. For all of that, Laravel Debugbar is one of those packages that saves the day without asking for anything in return. And yes, it's a visual, simple, and straightforward bar that activates instantly and reveals everything that's happening with each request.
In my case, the first time I installed it, it appeared immediately without touching anything, and that allowed me to instantly review which queries were being executed and how long they took. Since then, I have it in all my development environments.
We left off with knowing how to import or export Excel documents in Laravel
What is Laravel Debugbar and what is it really for?
Laravel Debugbar is a debugging tool that shows key information about the current HTTP request: SQL queries, execution time, exceptions, routes, views, logs, and much more. Think of it as a transparent window into the inner workings of your application.
Main advantages compared to traditional debugging
- You see the queries in real time and know exactly how many are executed.
- You can detect an N+1 in seconds.
- It allows you to validate routes, middleware, views, and data.
- It monitors times and performance visually.
- It does not require complex configuration.
When I use it in large projects, I love it because it brings to light everything that happens “behind the scenes,” even things I would normally ignore, like an extra session query or an event that fires unexpectedly.
When to use it and when to avoid it
Use it in development always.
Avoid it in production... except in extremely controlled cases (and even then, I'd prefer Telescope).
How to install Laravel Debugbar step by step
This package is a must-have when developing our Laravel application. From it, we can see different data such as which database queries are being executed and in what quantity, server response time, among others; for this, we use the following package:
https://github.com/barryvdh/laravel-debugbar
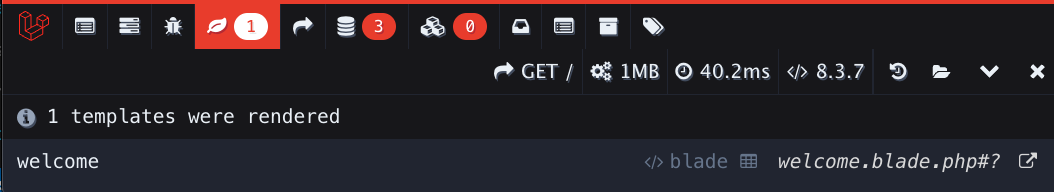
$ composer require barryvdh/laravel-debugbar --devIt is installed only for development (--dev) and is immediately available. In my experience, as soon as I finished installing it and reloaded the app, the bar appeared “just like that for free.”
Once installed, we will see:
How to correctly enable or disable Laravel Debugbar
To enable or disable the bar, we can use the environment variable (it is enabled by default):
DEBUGBAR_ENABLED Or
\Debugbar::enable(); \Debugbar::disable();Enable or disable from code
\Debugbar::enable(); \Debugbar::disable();Generated files and initial behavior after installation
Debugbar introduces a config file (debugbar.php) and activates automatically. Personally, I think it should come disabled by default, but I understand that the author does it so you can test the bar immediately.
Best practices to avoid uploading Debugbar to production
- Add DEBUGBAR_ENABLED=false to your .env.production.
- Never place custom Debugbar configurations in config:cache if you are going to deploy.
- Assume that "if it is enabled, it can break the view in production."
Key sections of Laravel Debugbar
- Queries: detecting N+1, number of queries, and times
- This is where I spend the most time. Debugbar lists all the queries that are executed in the request.
Once when working with a large project, I noticed an absurd increase in queries. When I opened Debugbar, I saw an N+1 that had crept into a Livewire component... It saved me hours of searching.
- This is where I spend the most time. Debugbar lists all the queries that are executed in the request.
- Timeline: measuring performance in each request
- It measures the times of each part of the lifecycle. It serves to detect bottlenecks, duplicated loads, or slow events.
- Views: template loading and injected data
- If something doesn't look right in your blade, here you can see what variables it is actually receiving.
- Exceptions: errors captured on the fly
- If something crashes, Debugbar captures it with a clean stack trace.
- Routes: executed routes and middlewares
- Perfect for validating which route is handling the request. It has helped me more than once when a middleware accidentally blocked a flow.
- Custom messages, logs, and events
- You can send messages to Debugbar:
\Debugbar::info("Probando debug");
Practical use examples (real development cases)
- Detecting an N+1 problem
- Every time I see a higher-than-normal number of queries, I open Debugbar and that's it: the repeated query appears immediately.
- Analyzing performance in large projects
- When I did tests on a complex project, Debugbar was perfect: full timeline, events, queries, routes, and views.
- Validating that a route returns what is expected
- If a route doesn't respond as it should, the routes and views panel gives you the answer immediately.
Frequently Asked Questions about Laravel Debugbar (FAQ)
- Why is Laravel Debugbar not appearing?
- Generally because of DEBUGBAR_ENABLED=false or because you are in production.
- Does it consume a lot of resources?
- In development, it can add overhead, but nothing alarming.
- Can I use it in production?
- Not recommended. Telescope is better.
- Debugbar or Telescope?
- Debugbar for quick development; Telescope for deep analysis.
- Which tab is the most useful?
- Queries, without a doubt. Network is also pure gold for optimization.
Conclusion
Laravel Debugbar is an essential tool in any development environment. It allows you to understand what your application is really doing, detect errors you didn't even know existed, and optimize times effortlessly. For me, it's one of those utilities I install out of habit when starting a new Laravel project.
Next step, learn how to debug your Laravel application on an Apache server.