
One of the problems that we can have when we are developing our responsive web applications is when we run the web application on a mobile or tablet that several things may go out of order, the letters are very small, some scroll bars that suddenly appear, etc. In short, it would be necessary to finish composing some elements.
The matter gets complicated if we start modifying the style sheet by eye without knowing for sure which HTML element with its CSS is the one that is failing, since from a mobile device we cannot open the Google Chrome developer console.
The mobile Google Chrome development console on our PC
Luckily Google thinks of everything and allows easy integration to debug a web page on our Android from a desktop PC through Google Chrome; The requirements are easy to meet, which are to have an Android device with at least Android 4 and a more or less updated Google Chrome:
Get Started with Remote Debugging Android Devices
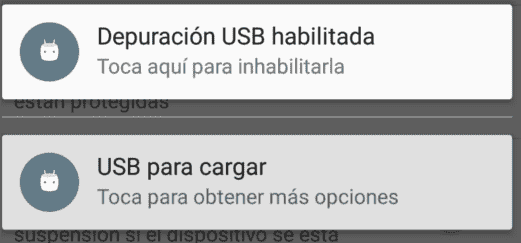
From our Android we have to have the development options enabled, which was covered a long time ago in: Configuring an Android device to develop and USB debugging enabled once the Android device is connected to our PC:
Doing cross debugging between our Android and the PC
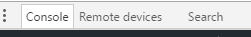
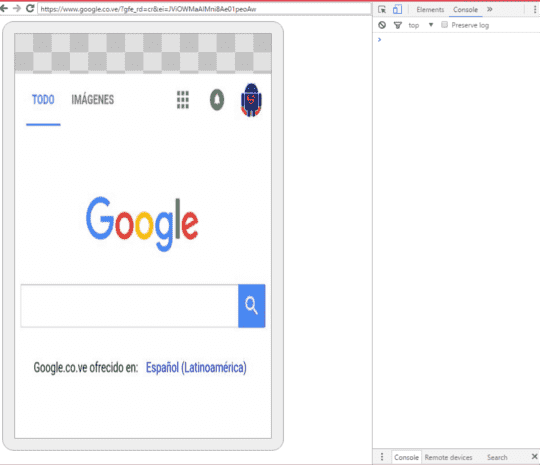
Now from our Google Chrome we go to the developer console, main menu (the 3 dots arranged vertically located in the upper right corner of the developer console) more tools - remove devices:

Now a tab will appear located in the lower corner of our Google Chrome which we must drag up and we will see the connected devices in it:
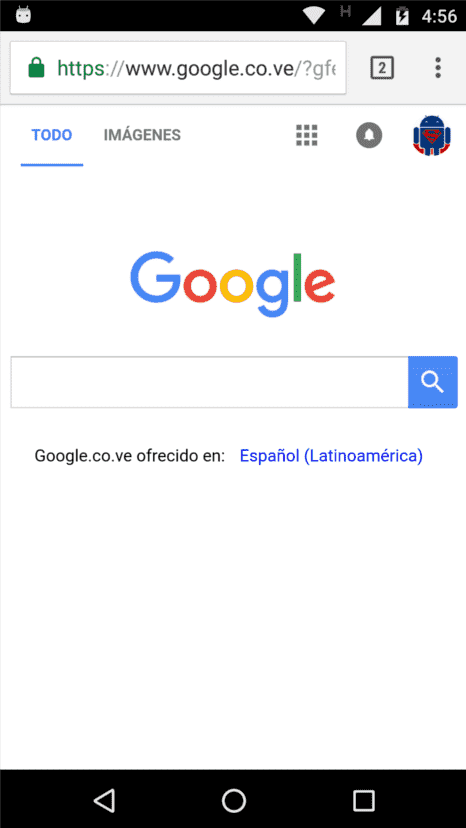
And we open our mobile Google Chrome on our Android and go to the page we want to debug:
Our device will appear in our developer console:
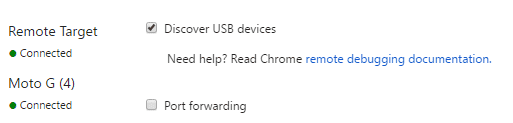
In my case it is a Moto G 4; when you click:

As we can see, we also have the option of entering the website manually; If we click on the "Inspect" button we can now use our developer console as we have always done and in this way we can debug an open website from our mobile on our PC:
Of course, to view the website we need to have our Android device unlocked.
I agree to receive announcements of interest about this Blog.
It explains how to debug our web pages from an Android device on our PC.
- Andrés Cruz