
One of the problems we can have when developing our responsive web applications is that when we run the web application on a mobile phone or tablet, several things might get misaligned: the letters might be too small, unexpected scrollbars might appear, etc. In short, some elements might need final composition.
The issue becomes complicated if we start modifying the stylesheet by eye without knowing for sure which HTML element with its CSS is failing, since we cannot open the Google Chrome developer console from a mobile device.
When you start developing web interfaces, sooner or later you discover that Google Chrome for developers is not just a browser: it is the central tool for debugging, inspecting, measuring, and understanding how your application behaves in real time. Chrome DevTools allows you to see everything from the layout to HTTP requests... and yes, even debug from an Android mobile connected to your PC, something that has saved my life more than once when a responsive view breaks without explanation.
Throughout this guide, I'll tell you everything Chrome offers from a real developer's perspective, with practical examples I've applied while debugging interfaces, correcting 500 errors, and keeping rebellious CSS under control.
Why Chrome is the Developers' Favorite Browser
DevTools and Complete Ecosystem
Chrome integrates a set of panels designed to cover every moment of the development cycle:
- Elements: visual inspection of the DOM and CSS.
- Network: tracking GET/POST requests, loading times, resource size.
- Console: messages, errors, and live debugging.
- Sources: breakpoints and JavaScript debugging.
- Performance: performance analysis and traces.
- Lighthouse: automated audits for SEO, accessibility, and performance.
It's a robust ecosystem, designed for developers who work fast and need clear answers.
Real Workflow (My Experience)
In my case, Chrome became essential when I was developing a responsive app: everything looked slightly "broken" on mobile; tiny text, unexpected scrollbars... the usual. I couldn't open the inspector from the mobile, so Chrome with remote debugging allowed me to see exactly which element was failing without guessing or blindly touching CSS.
Initial Setup of Developer Mode in Chrome
Activating DevTools and Essential Panels
You can open DevTools with:
- F12
- Ctrl + Shift + I
- Right click → Inspect
Chrome remembers your last configuration, so you can pin the panel you use most: Elements, Console, Network, or Sources.
Recommendation: activate the Device Toolbar (Ctrl + Shift + M) to emulate mobiles without needing to connect a device.
Shortcuts and Little-Known Features
- Ctrl + P: open any file loaded by the page.
- Ctrl + Shift + P: execute internal DevTools commands.
- Alt + Click on a CSS rule: edit multiple values.
- Ctrl + Shift + C: activate the visual selector to inspect elements.
Remote Debugging on Android with Google Chrome: The Mobile Developer Console on our PC
Fortunately, Google thinks of everything and allows for easy integration to debug a web page on our Android from a desktop PC via Google Chrome; the requirements are easy to meet, which are having an Android device with at least Android 4 and a somewhat up-to-date Google Chrome:
Get Started with Remote Debugging Android Devices
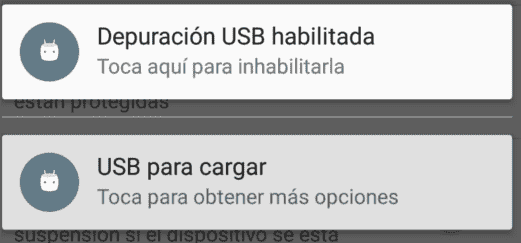
From our Android, we need to have the developer options enabled, which was covered quite some time ago in: Configuring an Android device for development and USB debugging enabled once the Android device is connected to our PC:
Cross-Debugging Between our Android and the PC
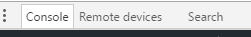
Now from our Google Chrome, we go to the developer console, main menu (the 3 vertical dots located in the upper right corner of the developer console) more tools - remote devices:

Now a tab will appear located in the lower corner of our Google Chrome which we must drag upwards and we will see the connected devices in it:
And we open our Google Chrome mobile on our Android and go to the page we want to debug:

Our device will appear in our developer console:
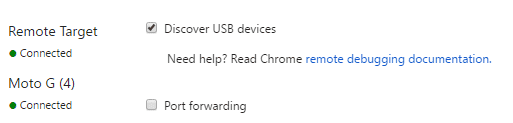
In my case, it's a Moto G 4; by clicking on it:

As we can see, we also have the option to manually enter the web address; if we click the "Inspect" button, we can now use our developer console as we always have, and in this way, we manage to debug a website opened from our mobile on our PC:
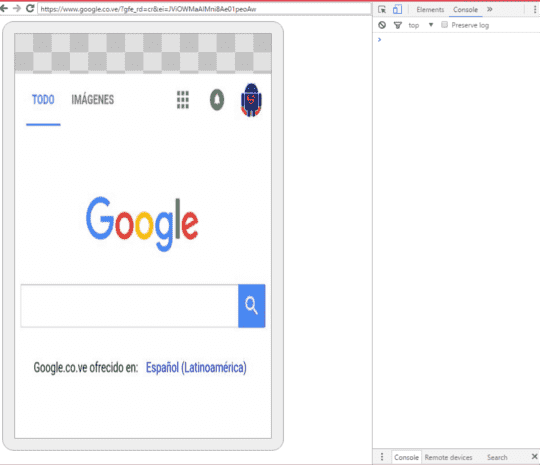
Of course, to see the website, we need to have our Android device unlocked.
In summary:
One of Chrome's most powerful features for developers is cross-debugging: seeing on your PC what's happening on your mobile.
Requirements: Android + USB Debugging:
- An Android mobile (Android 4+).
- Activate Developer Options.
- Enable USB Debugging.
- Connect the device via cable.
Open “Remote devices” from Chrome:
- Open DevTools.
- Go to More tools → Remote devices.
- A bottom panel will open which you can expand.
- Chrome will list your Android device automatically.
Inspect a mobile website as if it were desktop
When you open Chrome on your Android and visit the page you want to debug, it appears on your PC with an Inspect button:
- Complete DOM and CSS.
- Live screenshots.
- Touch event log.
- Shared console.
It's exactly like inspecting a desktop tab, but the actual view is the mobile one. Note: the device must remain unlocked.
How to Disable Cache in Google Chrome
In this short post, we will explain how to disable cache in Google Chrome.
Why do we want to disable cache in Google Chrome?
If you're a developer, which is highly probable if you are reading this, if Chrome is not your main browser as is my case, or at worst, one of your main browsers at least for testing your applications, you'll know that when developing our software it becomes very annoying to refresh the browser screen every time we make multiple changes to the application; the agony increases when adding small changes to stylesheets or JavaScript where sometimes the screen is refreshed up to 10 times without apparent success.
The solution to this problem is so simple it's scary; we simply have to open our Developer Console in Google Chrome and go to the Network tab, and there you'll find a checkbox called "Disable cache":
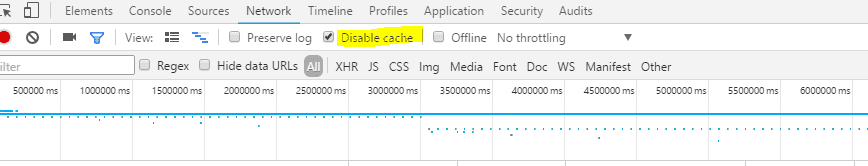
With this, the agony of repeatedly refreshing the same browser screen ends, and we can start to like our browser a bit more.
In this short post, we will explain how to disable cache in Google Chrome.
Why do we want to disable cache in Google Chrome?
If you're a developer, which is highly probable if you are reading this, if Chrome is not your main browser as is my case, or at worst, one of your main browsers at least for testing your applications, you'll know that when developing our software it becomes very annoying to refresh the browser screen every time we make multiple changes to the application; the agony increases when adding small changes to stylesheets or JavaScript where sometimes the screen is refreshed up to 10 times without apparent success.
The solution to this problem is so simple it's scary; we simply have to open our Developer Console in Google Chrome and go to the Network tab, and there you'll find a checkbox called "Disable cache":
With this, the agony of repeatedly refreshing the same browser screen ends, and we can start to like our browser a bit more.
Bypassing the Cache when Reloading a Tab
Another option we have when avoiding cache while developing our applications, if we don't want to disable the cache, is to force the refresh of all web resources by combining Ctrl + Alt + R; it's the same as pressing F5 but this refreshes all resources.
Resolving Requests from the Developer Console in Google Chrome
If you're a developer, which is highly probable if you are reading this, you'll know that one of the annoying things when developing is when creating views to get data in JSON format (i.e., resources from a URL which is accessed via JavaScript, for example) or sending data to the server; it's not always easy to detect the error or errors from the browser; fortunately, Google Chrome offers an interesting tool that allows monitoring HTTP requests of the sites we visit, although in our case it's of greater interest in the scope of developing our web applications.
Checking HTTP Requests in Google Chrome
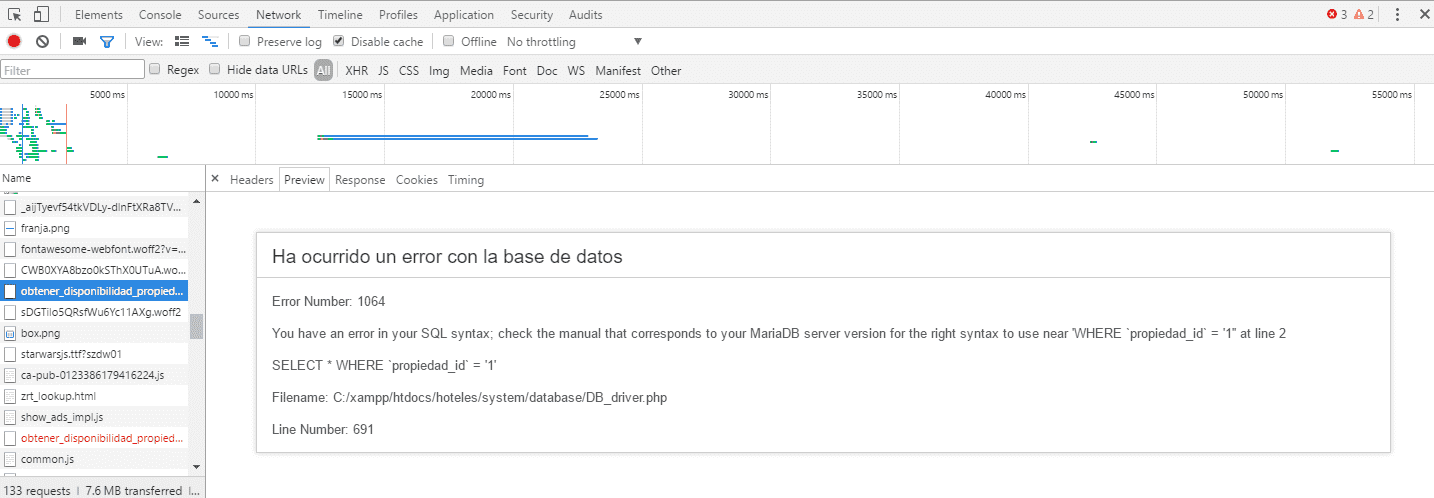
To see the HTTP requests we make from our application or website, we must first go to the Google Chrome developer console by pressing F12 or from the "More Tools" option in the menu, and we will see our developer console; for example, in the following image we see that an error occurred in one of the URLs executed by an internal JavaScript in the application:
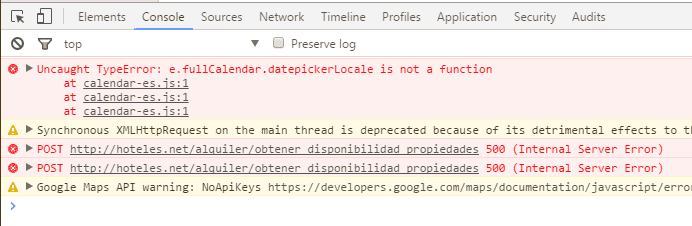
In this case, it's an Ajax request that sends a POST request to the server. If it were a GET request, the browser would compose the URL with the parameters and we could detect the error by opening the link in a browser tab, but since the request is made via a POST, this will not happen.
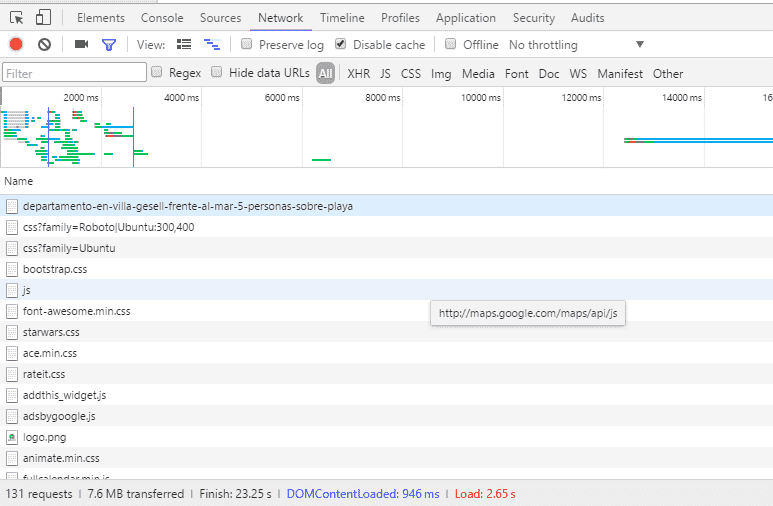
The Google Chrome developer console is useful for much more than just checking variable status, debugging, and viewing request states (generally 500, 404, and/or 200). We can also view the state perfectly as if we copied the request URL in the browser but without the need to do so; for this, we open our developer console with F12:
By default, when opening the console, we are on the "Console" option, we click on the "Network" tab and we will see a list of all requests made:
We look for the resource that caused the 500 error:
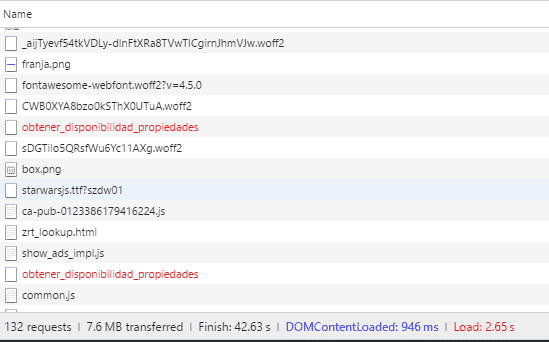
And we click on the resource that throws the 500 error:
As we can see, we can view the 500 error as if the request had been made in the tab where the application is running through the main thread of the application; this way, we can easily detect the error without needing to use other tools or place unnecessary print statements.
In summary:
While developing an app, the classic thing happened to me: I modified CSS and it seemed like nothing happened, even though I refreshed the page ten times. Until I realized the obvious:
- Open DevTools.
- Go to the Network panel.
- Activate the Disable cache option.
The difference is immediate. Changes appear instantly.
Shortcut for complete reload: CTRL + ALT + R
- If you don't want to permanently disable the cache, you can use:
- Ctrl + Alt + R
→ It's like a boosted F5: it reloads all resources, without using the cache.
Review HTTP requests and errors from Chrome DevTools from the Network Panel: GET, POST, and resource analysis:
- Headers
- Status codes (200, 404, 500)
- Parameters
- Script and resource loading
- Chronological order of requests
How to identify 404/500 errors in seconds:
When consuming Rest APIs, it's very common for something to return a 500, but since it was a POST request, I couldn't open the URL in a browser tab.
From Network:
- Locate the problematic request.
- Click on it.
- Observe the complete response: HTML, JSON, or server error.
Chrome displays the rendered response, as if the URL had been opened in its own tab. It is tremendously practical.
Practical Debugging Example (Personal Experience)
When I was debugging a resource that was failing due to an internal server error, Chrome showed me the content of the 500 error directly in Network. I didn't need external logs or manually test the URL: everything was there, live, without reloading the interface.
Best Practices for Web Development with Chrome
- Workflow Organization
- Keep only the necessary tabs open.
- Use split panels (Dock right or bottom).
- Take advantage of Local Overrides to modify files locally.
- Advanced CSS and Layout Inspection
- Use Layout → Flexbox/Grid overlays to see complex structures.
- Check Computed to detect unexpected inherited properties.
- Move values with the keyboard for precision adjustments.
- Tips for Optimizing Real-Time Performance
- Profile with Performance after major JS changes.
- Use Lighthouse to check accessibility and technical SEO.
- Monitor the Largest Contentful Paint and CLS for design improvements.
Frequently Asked Questions about Chrome for Developers
- Is Chrome DevTools available on all systems?
- Yes: Windows, macOS, Linux, and ChromeOS.
- Do I need to install extensions?
- No, DevTools is integrated, although useful extensions exist like React DevTools.
- Is Chrome Canary better for developers?
- It's more experimental: ideal if you want to try new features before they reach the stable version.
- Can I debug an iPhone from Chrome?
- Not directly. For iOS you need Safari.
Conclusion
Google Chrome for developers is probably the most complete tool for web debugging. From advanced CSS inspection to remote debugging on Android, passing through total control of HTTP requests, Chrome gives you everything you need to work efficiently and accurately.
And when you combine it with practices like disabling the cache or checking 500 errors in Network, the workflow improves enormously.