
Canvas is one of the most powerful technologies we can use in web development. In essence, it is nothing more than a digital canvas that allows creating all kinds of graphics starting from standard primitives: lines, circles, squares, and rectangles, as we will see later in this post. In addition to delving into the use of the Canvas API, you will find tutorials with different real-world use cases —from image cropping to pixel processing— so you can explore its full potential.
Once we clarify what Canvas is, the next thing we should know is its compatibility. Nowadays, the vast majority of browsers have native support for working with the Canvas API; major ones like Google Chrome, Firefox, and even Microsoft browsers support this technology, allowing us to draw graphics as simple or complex as we need, perform image or photo compositions, and even render video in real time.
In short, Canvas is basically that: a canvas where we can create any type of drawing controlled through code.
It all begins through the <canvas> tag, which enables an area (the canvas) where it is possible to draw, write, or render images using scripts made with JavaScript, the chosen programming language to work with this technology:
<canvas id="myCanvas" width="500" height="500">
<p>Su navegador no soporta canvas :(</p>
</canvas>
With canvas it is possible to create all kinds of graphics, simple or complex, from basic primitives like circles, ovals, rectangles, lines, and polygons. Furthermore, they are easily animatable thanks to the requestAnimationFrame method. Canvas is also extensible to include keyboard and mouse events, among many other features that would otherwise (with CSS alone) be practically impossible or very difficult to replicate.
Canvas support in browsers
Modern browsers have had native support for the <canvas> tag for a long time; however, verifying this support is recommended. As with many other HTML5 tags, anything located between the opening and closing <canvas> tags will only be interpreted by browsers that do not support the tag:
  <canvas>
    Su navegador no soporta Canvas
  </canvas>
At the JavaScript level, we can perform the following validation to check if the Canvas API is supported in the user's browser:
function isCanvasSupported(){
  var elem = document.createElement('canvas');
  return !!(elem.getContext && elem.getContext('2d'));
}
The above leads us to the fact that the canvas element accepts three essential attributes (although one of them can also be defined from CSS): id, which is how we reference it from JavaScript, and the width and height, defined respectively by width and height.
Some advantages of using Canvas in your applications
- Animatable. Every object we draw on the canvas can be animated with total control over each frame.
- Interactive. Canvas is 100% interactive and responds to all keyboard and mouse actions through JavaScript's event system.
- Flexible. We can draw anything on the Canvas: images, lines, geometric shapes, polygons, etc., and animate each of those objects independently.
- Browser support. Most modern browsers have supported canvas for years, so you don't need additional libraries to start using it.
- Canvas is a standard. Unlike other technologies such as Flash or Silverlight —now practically extinct—, Canvas is part of the HTML5 specification and any self-respecting modern browser must support it.
<canvas> tags will only be displayed in browsers that do not support the tag. This is the native HTML5 fallback mechanism.Examples and Tutorials on Canvas: How does the canvas tag work?
Let's get to the interesting part and start with our first example. With three simple steps, we can start working with this tag:
1. Referencing the DOM Canvas with JavaScript
First, get a reference to the canvas we want to work with. In this case, the <canvas> tag has the ID myCanvas:
var myCanvas = document.getElementById("myCanvas")2. Getting the Canvas context via JavaScript
To perform any operation with the canvas —whether drawing graphics or images— we must get the context of the canvas element and, thus, access the entire API:
The canvas context is the object that exposes all available methods and properties for drawing on it. Without obtaining it, it is impossible to draw anything. The value "2d" indicates that we will work with two-dimensional graphics; there is also the "webgl" context for hardware-accelerated 3D graphics.
var ctx = c.getContext("2d");3. Drawing primitives
Now we can start drawing on our canvas. Let's look at a series of examples illustrating the most common uses of the API.
3.1 Drawing a line with Canvas
The simplest experiment we can do consists of drawing a simple line: the "Hello World" of the Canvas world. For this, we need the following methods:
moveTo(x, y)— starting point of the line.lineTo(x, y)— ending point of the line.stroke()— effectively draws the line on the canvas.
3.2 Drawing a circle with Canvas
To draw a circle on the canvas we must use the following methods:
- A path is a set of paths that we make inside a canvas. To start it, we use
beginPath()and we close it withclosePath(). Nothing inside the path will be visible until we instruct the context to draw it withstroke(). arc(x, y, r, start, end)— draws an arc or circle on the canvas:xandy: coordinates of the center of the circle.r: radius of the circle.startandend: starting and ending angle, expressed in radians. For a complete circle, typical values are0andMath.PI * 2.
lineTo(x, y)— ending point of the line (useful to close the path).stroke()— renders the outline of the path.
3.3 Drawing text with Canvas
To draw text inside the canvas, there are two main methods, each with a different visual result:
font— property that defines the font, size, and style of the text (for example,"16px Arial").fillText(text, x, y)— draws the text with solid fill at the indicated position.strokeText(text, x, y)— draws the text without fill (outline only) at the position specified byxandy.stroke()— renders the active path.
3.4 Drawing an image with Canvas
You might wonder what the objective is of drawing an image on a canvas. The answer is that, besides being able to mix it with other primitives and images, we can alter each of the pixels that compose it to apply Digital Image Processing techniques: croppings, grayscale, contrast adjustment, RGB channel extraction, among other experiments that we will explore in the following sections.
Drawing a line in a Loop with HTML5 Canvas
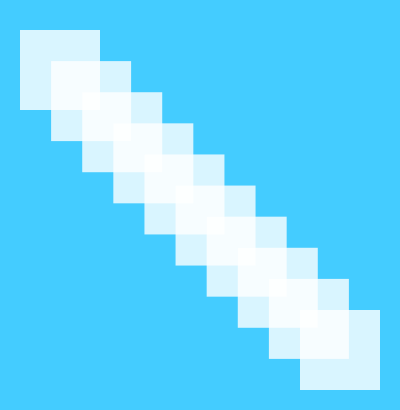
In this article, we will see how to draw a line inside a loop in HTML5, specifically with the Canvas API. Although the API already offers the lineTo() primitive to draw lines, in this exercise we will construct a line from variable-sized squares that will act as the "pixels" that make it up. To draw each square we will use the following function:
ctx.fillRect(X, Y, Width, Height);X: X coordinate of the top-left corner of the rectangle.Y: Y coordinate of the top-left corner of the rectangle.Width: Width of the rectangle in pixels.Height: Height of the rectangle in pixels.
Drawing the line with the Canvas API
First, we define the Canvas size in pixels; in this case, it will be a square:
var tamCanvas = 360;Next, we define how many "pixels" the line will have and what the size of each will be:
var numCuadrados = 10;
var tam = 100;
Now we calculate the spacing between the "pixels"; this value will decrease as we increase the number of rectangles, so that the line always occupies the entire canvas:
var espaciado = (tamCanvas - tam) / (numCuadrados - 1);Finally, we run the loop where we draw the squares that will form the line:
for (var i = 0; i < numCuadrados; i++) {
    ctx.fillStyle = "rgba(255, 255, 255, 0.8)";
    ctx.fillRect(i * espaciado, i * espaciado, tam, tam);
}Interactive example
If you have any doubts about the effect of each parameter, in this interactive example you can vary their values in real time:
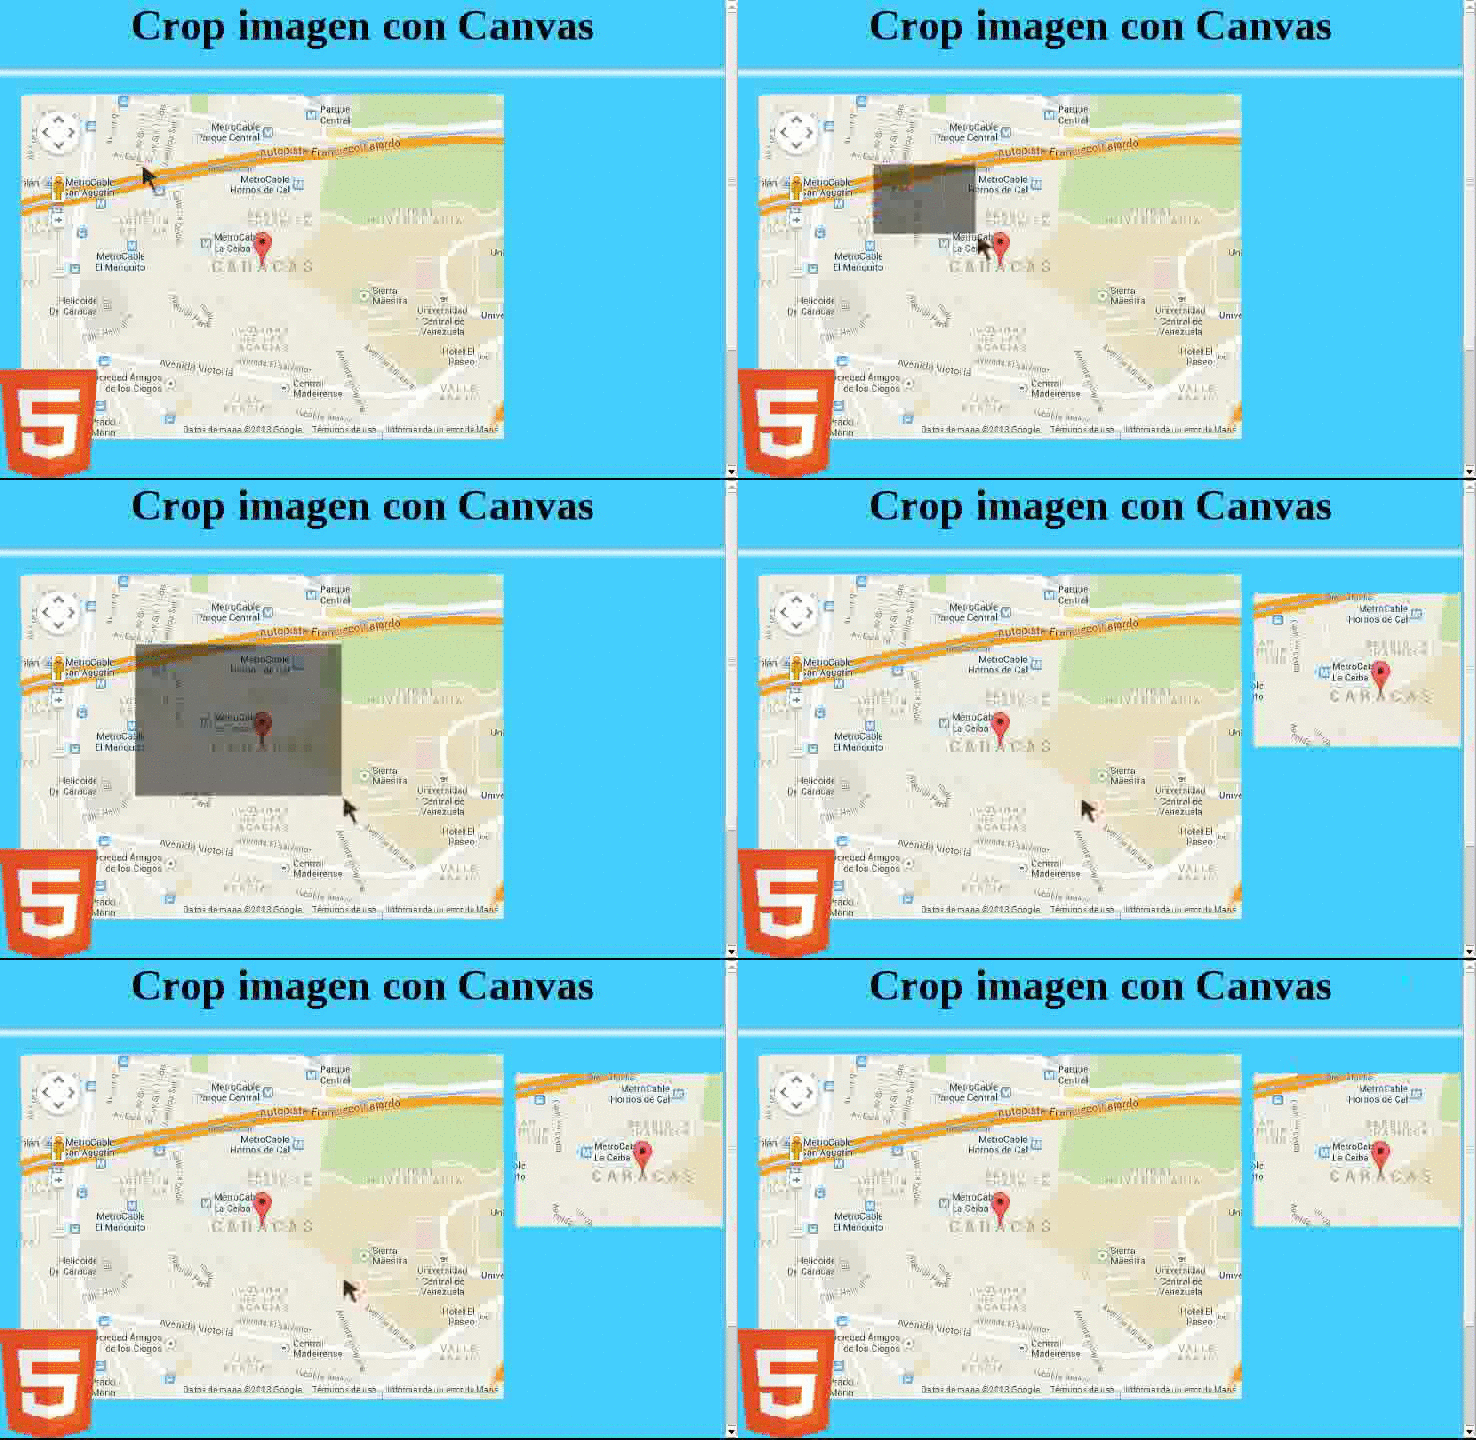
Image cropping (crop) with HTML5 Canvas
Being able to crop images —an operation also known as crop— is extremely useful in certain scenarios: subdividing images into pieces is a very common operation in current web development, and there are multiple situations where you will want a web application to apply a crop on an image and then allow it to be downloaded.
In this article, we will see how to crop images and save them on the user's device with HTML5, using the following technologies:
- Canvas and its JavaScript API to cut, load, and save the resulting image.
- Native JavaScript for event handling and some supporting helper functions.
How the image cropping experiment works
The operation is simple and can be summarized as follows:
- The user makes a first click on the canvas; we capture the coordinates of that click.
- The user drags the mouse (without holding the click) until reaching the point of interest; as they move, a hover will be displayed representing the crop area calculated from the first click.
- The user makes a second click on the canvas; we capture those coordinates.
- The cropped image is generated from the selection made.
It is the same workflow as image editors like GIMP or Photoshop: first you select, then you crop.
The drawImage() method
The drawImage() method allows drawing an image, a canvas, or a video inside a canvas. Its mandatory parameters are:
- Element: image, video, or canvas to use as source.
x: X coordinate where drawing will start on the destination canvas.y: Y coordinate where drawing will start on the destination canvas.
The behavior varies depending on the number of parameters passed to it:
drawImage(img, x, y): draws the full image on the canvas starting at coordinatesxandy.drawImage(img, x, y, width, height): copies the image starting from pointsxandy, scaling it to the dimensions defined bywidthandheight.drawImage(img, sx, sy, swidth, sheight, x, y, width, height): crops the image starting from pointssxandsywith dimensionsswidthandsheight, and draws it on the canvas at coordinatesx,ywith the size indicated bywidthandheight.
1. Global variables and initialization
In this part, we will define the experiment variables. The function of each is explained in the code comments:
//*** global variables
// canvas and its context
var canvas = document.getElementById('canvas');
var ctx = canvas.getContext('2d');
// image where the cropped image will be placed
var canvasImg = document.getElementById('canvasImg');
// path to the source image
var imgSource = "image.jpg";
// X and Y point of the first click on the canvas
var iniX;
var iniY;
// X and Y point of the second click on the canvas
var endX;
var endY;
// width and height calculated from the two clicks
var imgW;
var imgH;
// hover that will overlay the canvas according to user selection
var hover = document.getElementById('hoverCut');

// initialize components for image cropping
function init() {
    iniX = -1;
    iniY = -1;
    endX = -1;
    endY = -1;
    imgW = -1;
    imgH = -1;
    hoverBol = false;
    hover.style.width = "0";
    hover.style.height = "0";
}
The init() method initializes the variables and disables the hover (setting its width and height to zero). It will be automatically invoked every time the user completes a crop on the Canvas.
2. Drawing an image on the Canvas
We define a method to load the source image onto the Canvas. It is important to wait until the image is fully loaded before drawing it, hence the use of the onload event:
function loadImageToCanvas() {
    newImg = new Image();
    newImg.src = imgSource;
    newImg.onload = function() {
        // rescale canvas to image size
        canvas.width = newImg.width;
        canvas.height = newImg.height;
        ctx.drawImage(newImg, 0, 0);
    };
}
3. Returning Canvas content to an <img> tag
Previously we passed the content of an image to the Canvas; now we will do the opposite. The following method exports the Canvas to an <img> tag and also copies that content into an <a> link so the user can download the cropped image. This is possible thanks to the toDataURL() method, which converts the canvas content into a base64 string:
function saveCanvasToImage() {
    var dataURL = canvas.toDataURL();
    canvasImg.src = dataURL;
    document.getElementById("downloadImage").href = dataURL;
}
4. Click event on the Canvas
We capture two clicks from the user on the Canvas to calculate the rectangular area to crop:
canvas.addEventListener('click', function(e) {
    const rect = canvas.getBoundingClientRect();

    // We use pageX/Y to get the absolute position in the document (includes scroll)
    const auxX = e.pageX - (rect.left + window.scrollX);
    const auxY = e.pageY - (rect.top + window.scrollY);

    if (iniX < 0) {
        iniX = auxX;
        iniY = auxY;
        hover.style.left = e.pageX + "px";
        hover.style.top = e.pageY + "px";
    } else {
        endX = auxX;
        endY = auxY;
        imgW = endX - iniX;
        imgH = endY - iniY;
        const newImg = new Image();
        newImg.src = imgSource;
        newImg.onload = function() {
            canvas.width = imgW;
            canvas.height = imgH;
            ctx.clearRect(0, 0, imgW, imgH);
            ctx.drawImage(newImg, iniX, iniY, imgW, imgH, 0, 0, imgW, imgH);
            saveCanvasToImage();
            loadImageToCanvas();
            init();
        };
    }
});
Analyzing the function above...
The body of the click event handler is divided into two blocks. We use the iniX variable as a flag:
- If
iniXis less than zero, it is the user's first click on the Canvas. - If
iniXis different from-1, it is the second click and the crop is executed.
The key part is capturing coordinates relative to the canvas:
const rect = canvas.getBoundingClientRect();
const auxX = e.clientX - rect.left + window.scrollX;
const auxY = e.clientY - rect.top + window.scrollY;e.clientXande.clientYcapture the click coordinates relative to the window.getBoundingClientRect()returns the canvas rectangle relative to the browser window, allowing us to convert those coordinates to the canvas reference system.window.scrollXandwindow.scrollYcompensate for page scroll when the user has scrolled before clicking.
5. The hover over the Canvas
We place a semi-transparent div that extends from the first click to the current mouse position. We repeatedly update its width and height as the user moves the mouse:
canvas.addEventListener('mousemove', function(e) {
    if (iniX >= 0) {
        const rect = canvas.getBoundingClientRect();
        const currentX = e.pageX - (rect.left + window.scrollX);
        const currentY = e.pageY - (rect.top + window.scrollY);

        imgW = Math.abs(currentX - iniX);
        imgH = Math.abs(currentY - iniY);

        if (currentX < iniX) {
            hover.style.left = e.pageX + "px";
        }
        if (currentY < iniY) {
            hover.style.top = e.pageY + "px";
        }
        hover.style.width = (imgW - 3) + "px";
        hover.style.height = (imgH - 3) + "px";
    }
});
Final Result:
There is another way to apply crops without Canvas: negative margins in CSS. However, with that technique you can only crop from the edges, not from inside the image. Another alternative is the clip-path property, which you can explore in detail in this post:
The clip-path property in CSS to select regions to display on elements
Detecting keyboard events with Canvas
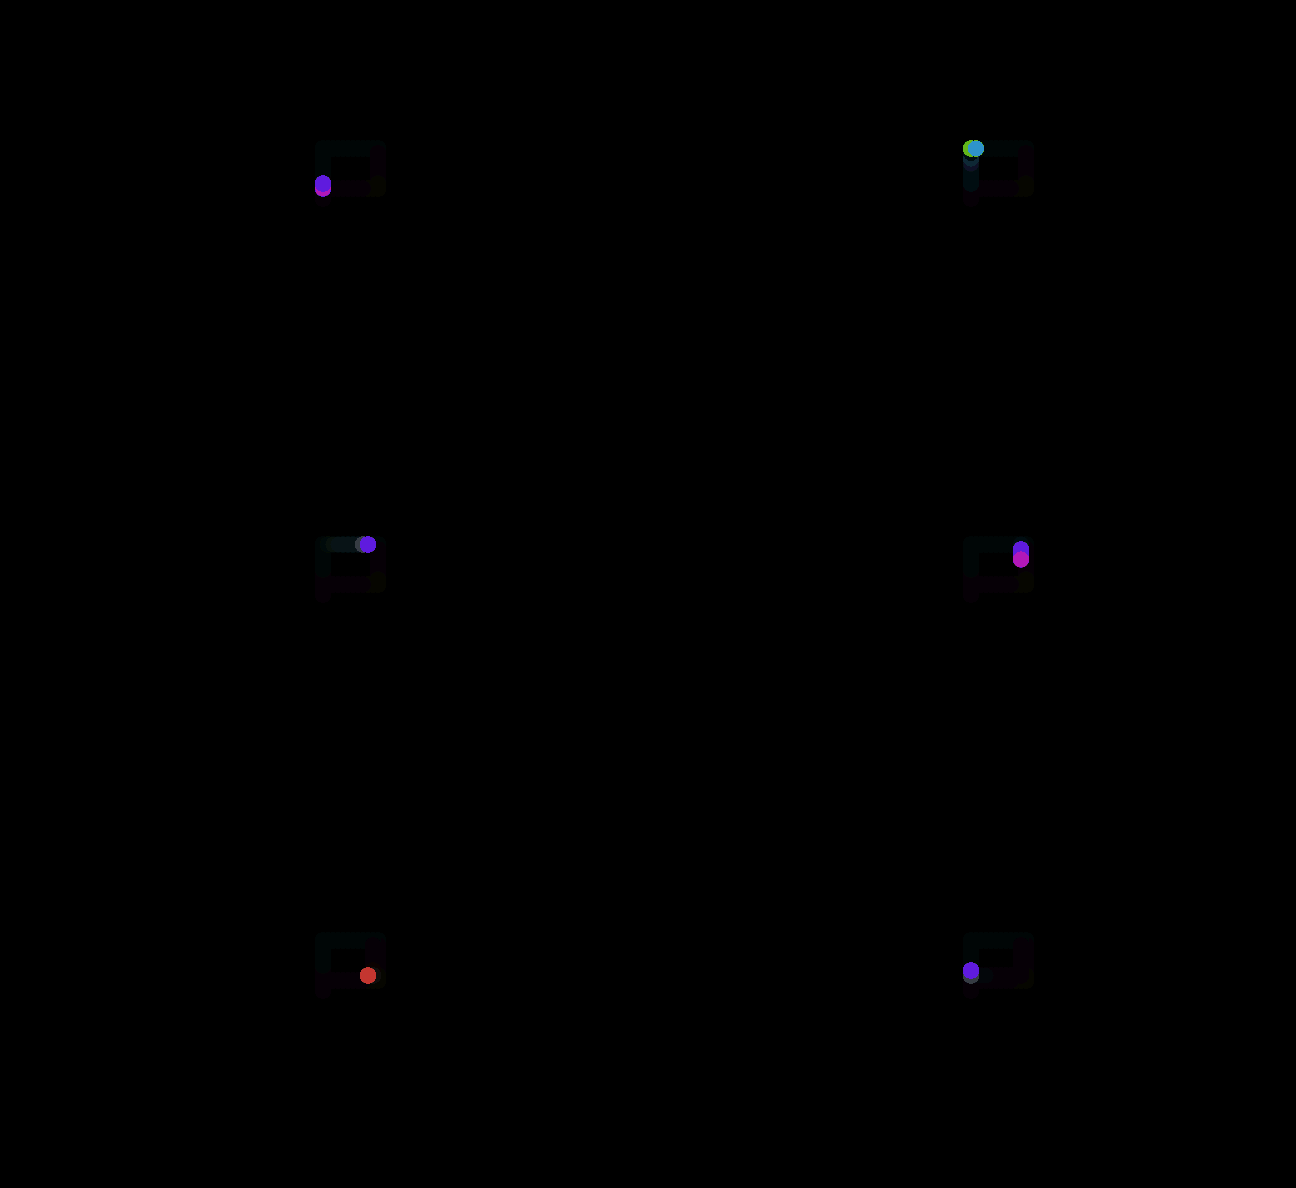
Below, we will see a small experiment where we interact with the Canvas through keyboard events; specifically, we will use the arrow keys to move an object around the canvas.
Creating animations with JavaScript and Canvas that depend on external agents like the keyboard or mouse is much simpler than it seems.
When introducing the concept of animation, the requestAnimationFrame() function comes into play, allowing efficient animations in Canvas synchronized with the monitor's refresh rate. If you want to delve deeper into how it works, you can do so at: The secret of animations in JavaScript.
Starting with the experiment: Canvas, animations, and keyboard events
The experiment consists of moving a small circle across the entire Canvas, leaving a light color trail in its path, controlled using the keyboard arrow keys.
Initializing the keyboard event
We will attach the event to the document, although it could also be attached directly to the Canvas:
document.addEventListener('keydown', function(e) { }, false);In the 'keydown' listener, we will associate the arrow key codes with the circle's position variables. These variables are updated here and read on each call to requestAnimationFrame().
You can look up the codes for each key in the browser documentation, or simply add a console.log(e.keyCode) and check the value when pressing the key you are interested in.
Once we have the codes, we build the conditionals to increment or decrement the position variables:
document.addEventListener('keydown', function (e) {
    lastDownTarget = event.target;
    if (e.keyCode === 37) { x -= v; }  // left arrow
    if (e.keyCode === 38) { y -= v; }  // up arrow
    if (e.keyCode === 39) { x += v; }  // right arrow
    if (e.keyCode === 40) { y += v; }  // down arrow
}, false);xandyare global variables representing the circle's position at a given moment; by default, they are initialized in the center of the canvas.vis a global constant controlling the circle's movement speed.
Drawing on the Canvas
Now we will see how to use the position variables to draw the circle on each frame:
function draw() {
    $.fillStyle = 'hsla(' + (x * y) / 100 + ',100%, 50%, 1)';
    $.beginPath();
    $.arc(x, y, 8, 0, dosPi);
    $.fill();
}
The main function of the animation loop is responsible for clearing the canvas, limiting movement within the canvas boundaries, and requesting the next frame using requestAnimationFrame():
function go() {
    $.fillStyle = 'hsla(0,0%,0%,.08)';
    $.fillRect(0, 0, w, h);
    if (x <= 0) x = 0;
    if (y <= 0) y = 0;
    if (x >= w) x = w;
    if (y >= h) y = h;
    draw();
    window.requestAnimationFrame(go);
}
The complete code for the experiment with Canvas and keyboard events:
var c = document.getElementById('canv');
var w = c.width = window.innerWidth;
var h = c.height = window.innerHeight;
var $ = c.getContext('2d');
var x = w / 2;
var y = h / 2;
var dosPi = Math.PI * 2;
var v = 5;

window.addEventListener('resize', function () {
    c.width = window.innerWidth;
    c.height = window.innerHeight;
}, false);

function draw() {
    $.fillStyle = 'hsla(' + (x * y) / 100 + ',100%, 50%, 1)';
    $.beginPath();
    $.arc(x, y, 8, 0, dosPi);
    $.fill();
}

function go() {
    $.fillStyle = 'hsla(0,0%,0%,.08)';
    $.fillRect(0, 0, w, h);
    if (x <= 0) x = 0;
    if (y <= 0) y = 0;
    if (x >= w) x = w;
    if (y >= h) y = h;
    draw();
    window.requestAnimationFrame(go);
}

go();

document.addEventListener('keydown', function (e) {
    lastDownTarget = event.target;
    if (e.keyCode === 37) { x -= v; }
    if (e.keyCode === 38) { y -= v; }
    if (e.keyCode === 39) { x += v; }
    if (e.keyCode === 40) { y += v; }
}, false);
And so as not to extend this post too much, we will leave it here; in future installments, we will delve into more ways to interact with the Canvas through keyboard events.
You can test the experiment at the following link:
Image scaling and cropping with Canvas
Continuing with the Canvas tutorials, we will see how to apply cropping to specific sections of an image —an operation known as crop— and how to scale it. With the canvas, it is possible to perform both operations using a single function: drawImage(). As we have already seen, the behavior of this function varies depending on the number of parameters. Let's review the three modes:
Parameters of the drawImage() function
| Parameter | Description |
|---|---|
| Element | Image, video, or canvas to use as the source. |
sx | Optional. X coordinate to start the crop on the source element. |
sy | Optional. Y coordinate to start the crop on the source element. |
swidth | Optional. Width of the cropped area on the source element. |
sheight | Optional. Height of the cropped area on the source element. |
x | X coordinate where drawing will start on the destination canvas. |
y | Y coordinate where drawing will start on the destination canvas. |
width | Optional. Desired width on the canvas; allows scaling the image horizontally. |
height | Optional. Desired height on the canvas; allows scaling the image vertically. |
Drawing an image on the Canvas
We specify the source image in HTML and reference it from JavaScript:
<img src="/public/images/example/paisaje/paisaje.jpg" alt="landscape" id="paisaje">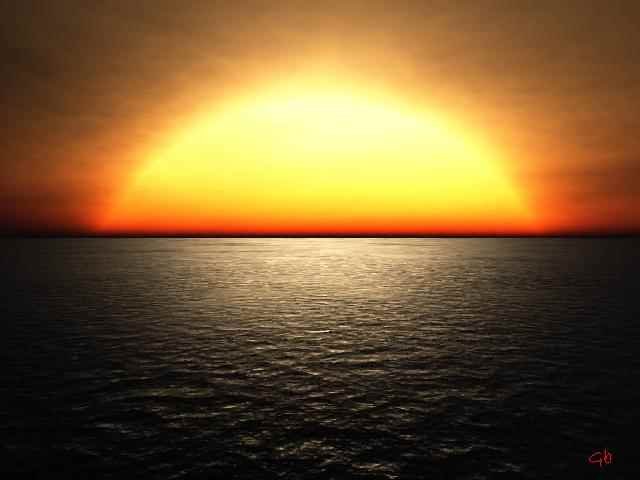
We proceed to draw it on the Canvas:
var img = document.getElementById('paisaje');
drawImage(img, x, y);
The image is copied to the Canvas starting from the points defined by x and y. If you want to copy it entirely from the top left corner, both coordinates must be 0.
Scaling an image with Canvas
drawImage(image, x, y, width, height);The image is copied to the Canvas starting from points x and y, scaling it to the dimensions defined by width and height. If these values differ from the original ones, the Canvas will scale the image automatically.
Cropping and scaling an image with JavaScript
This is the most comprehensive mode of the drawImage() method: we use all its parameters to indicate both the cropping area on the source image and the final dimensions on the destination canvas:
drawImage(image, sx, sy, swidth, sheight, x, y, width, height);The image is cropped starting from points sx and sy with the dimensions swidth and sheight. Conceptually, it would be like making a selection with the crop tool in GIMP.
Then, the last four parameters control the result: x and y position the image on the destination canvas, while width and height define the final dimensions. If you don't want to scale the image, it is enough for width = swidth and height = sheight.
How to obtain the RGB channel of an image separately using HTML5 and the Canvas API?
Digital image processing is a frequent task in web development: from resizing an image for optimization to applying crops or altering color, brightness, saturation, and even extracting each of the RGB channels of an image separately using Canvas, as we will see in this section.
We will look at a tutorial on how to extract the three RGB channels of an image and operate on them individually, obtaining the R, G, and B channels separately as seen in the header image. As in previous articles, we will use HTML5 and native JavaScript.
Defining the HTML
The HTML is really simple: a <canvas> element to draw the base image with its three channels intact:
<canvas id="canvas">
    <p>Your browser does not support Canvas.</p>
</canvas>
And three empty <img> tags where we will place each RGB channel using JavaScript:
<img id="r"/>
<img id="g"/>
<img id="b"/>
Defining JavaScript to obtain the RGB channels of the image
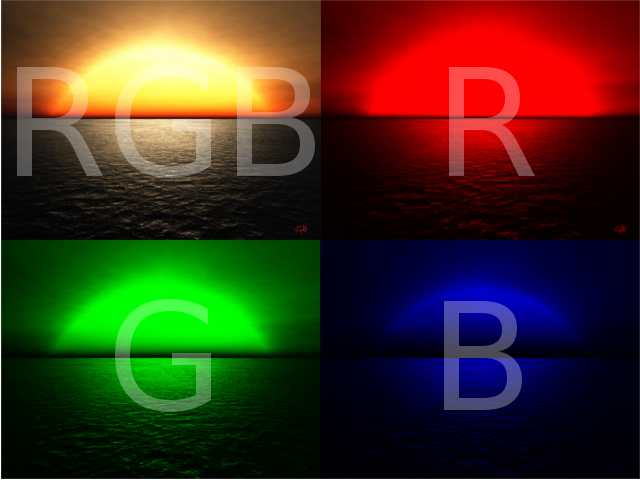
The first thing is to declare the global variables to get the canvas, its context, and the references to the three empty images:
var canvas = document.getElementById('canvas'); // canvas
var ctx    = canvas.getContext('2d');            // context
var imgR   = document.getElementById('r');      // R channel image
var imgG   = document.getElementById('g');      // G channel image
var imgB   = document.getElementById('b');      // B channel image
var srcImg = "image.png";                       // source image
We create an Image object and assign it the source image:
img = new Image();
img.src = srcImg;
Once loaded, we resize the Canvas to the dimensions of the image, draw it on it, and invoke getRGB():
img.onload = function() {
    canvas.width  = img.width;
    canvas.height = img.height;
    ctx.drawImage(this, 0, 0);
    getRGB();
};
The getRGB() function obtains the ImageData of the image —a flat array where each group of four consecutive values represents the R, G, B, and A channels of a pixel— and creates three independent copies. In each copy, it zero-outs the two non-corresponding channels, leaving only the channel of interest active. Then, it dumps each copy back to the canvas and uses toDataURL() to export it as an image source:
function getRGB() {
    var imgd  = ctx.getImageData(0, 0, canvas.width, canvas.height);
    var imgdR = ctx.getImageData(0, 0, canvas.width, canvas.height);
    var imgdG = ctx.getImageData(0, 0, canvas.width, canvas.height);
    var imgdB = ctx.getImageData(0, 0, canvas.width, canvas.height);

    var pixR = imgdR.data;
    var pixG = imgdG.data;
    var pixB = imgdB.data;
    var pix  = imgd.data;

    // iterate step-by-step 4 by 4: [R, G, B, A] for each pixel
    for (var i = 0, n = pixR.length; i < n; i += 4) {
        pixR[i + 1] = 0; // nullify G in R copy
        pixR[i + 2] = 0; // nullify B in R copy
        pixG[i]     = 0; // nullify R in G copy
        pixG[i + 2] = 0; // nullify B in G copy
        pixB[i]     = 0; // nullify R in B copy
        pixB[i + 1] = 0; // nullify G in B copy
    }

    ctx.putImageData(imgdR, 0, 0);
    imgR.src = canvas.toDataURL();

    ctx.putImageData(imgdG, 0, 0);
    imgG.src = canvas.toDataURL();

    ctx.putImageData(imgdB, 0, 0);
    imgB.src = canvas.toDataURL();

    // restore the original image on Canvas
    ctx.putImageData(imgd, 0, 0);
}
Analyzing the getRGB() function in detail
We get four copies of the ImageData: one complete (to restore the original at the end) and three to work channel by channel:
var imgd  = ctx.getImageData(0, 0, canvas.width, canvas.height);
var imgdR = ctx.getImageData(0, 0, canvas.width, canvas.height);
var imgdG = ctx.getImageData(0, 0, canvas.width, canvas.height);
var imgdB = ctx.getImageData(0, 0, canvas.width, canvas.height);
We access the pixel arrays of each copy:
var pixR = imgdR.data;
var pixG = imgdG.data;
var pixB = imgdB.data;
var pix  = imgd.data;
The loop is the heart of the exercise: in each group of four positions, we keep only the channel of interest and set the others to zero:
for (var i = 0, n = pixR.length; i < n; i += 4) {
    pixR[i + 1] = 0; // G → 0 in R copy
    pixR[i + 2] = 0; // B → 0 in R copy
    pixG[i]     = 0; // R → 0 in G copy
    pixG[i + 2] = 0; // B → 0 in G copy
    pixB[i]     = 0; // R → 0 in B copy
    pixB[i + 1] = 0; // G → 0 in B copy
}
Finally, we save each channel in its corresponding image using putImageData() and toDataURL():
ctx.putImageData(imgdR, 0, 0);
imgR.src = canvas.toDataURL();

ctx.putImageData(imgdG, 0, 0);
imgG.src = canvas.toDataURL();

ctx.putImageData(imgdB, 0, 0);
imgB.src = canvas.toDataURL();

ctx.putImageData(imgd, 0, 0); // restore original
Final Result
As we can appreciate, with HTML5 and the Canvas API we can do practically anything: games, text editors, image processors... imagination is the limit.
How to get black and white or grayscale images using HTML5?
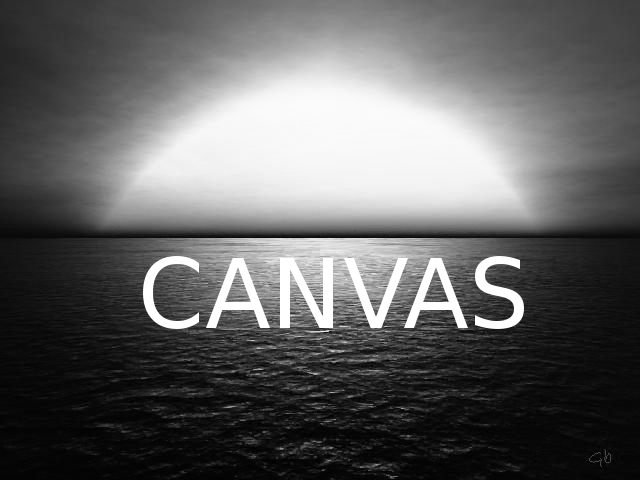
HTML5 opens the door to endless possibilities for digital image processing. In this installment, we will see how to convert an image to grayscale (or black and white) using the Canvas API.
Defining HTML for grayscale processing
The <canvas> tag allows us to access the entire Canvas API and, specifically for this tutorial, gives us pixel-level access to the image for processing:
<canvas id="canvas">
    <p>Your browser does not support Canvas.</p>
</canvas>
We also need an <img> tag where we will display the image in grayscale once processed:
<img id="resul"/>JavaScript to reference the Canvas
We define the necessary global variables:
var canvas   = document.getElementById('canvas');
var ctx      = canvas.getContext('2d');
var imgResul = document.getElementById('resul');
var srcImg   = "image.png";
We create an Image object, assign the source image to it, and draw it on the Canvas once loaded:
img = new Image();
img.src = srcImg;
img.onload = function() {
    canvas.width  = img.width;
    canvas.height = img.height;
    ctx.drawImage(this, 0, 0);
    getGrayScale();
};
The heart of the exercise: we get the ImageData and calculate the average of the three RGB channels for each pixel to obtain the corresponding gray tone:
var imgData = ctx.getImageData(0, 0, canvas.width, canvas.height).data;In the loop, we calculate the average of the R, G, and B channels:
gray = parseInt((imgData[i] + imgData[i + 1] + imgData[i + 2]) / 3);And we replace all three channels with that average:
imgData[i]     = gray; // R
imgData[i + 1] = gray; // G
imgData[i + 2] = gray; // B
We would obtain a similar result by setting channels equal to each other; for example:
imgData[i + 1] = imgData[i];
imgData[i + 2] = imgData[i];
However, the averaging method produces a more balanced and natural result.
Final result for grayscale
Black and white or grayscale images with CSS only
It is also possible to convert images to grayscale using a simple CSS filter, as seen in our post on CSS3 filters:
img {
   filter: grayscale(100%);
}
The advantage of this solution is its simplicity; the disadvantage is that it is purely visual: it does not generate a new image file or allow pixel-level manipulation like the Canvas API does.
How to change the contrast of an image with HTML5?
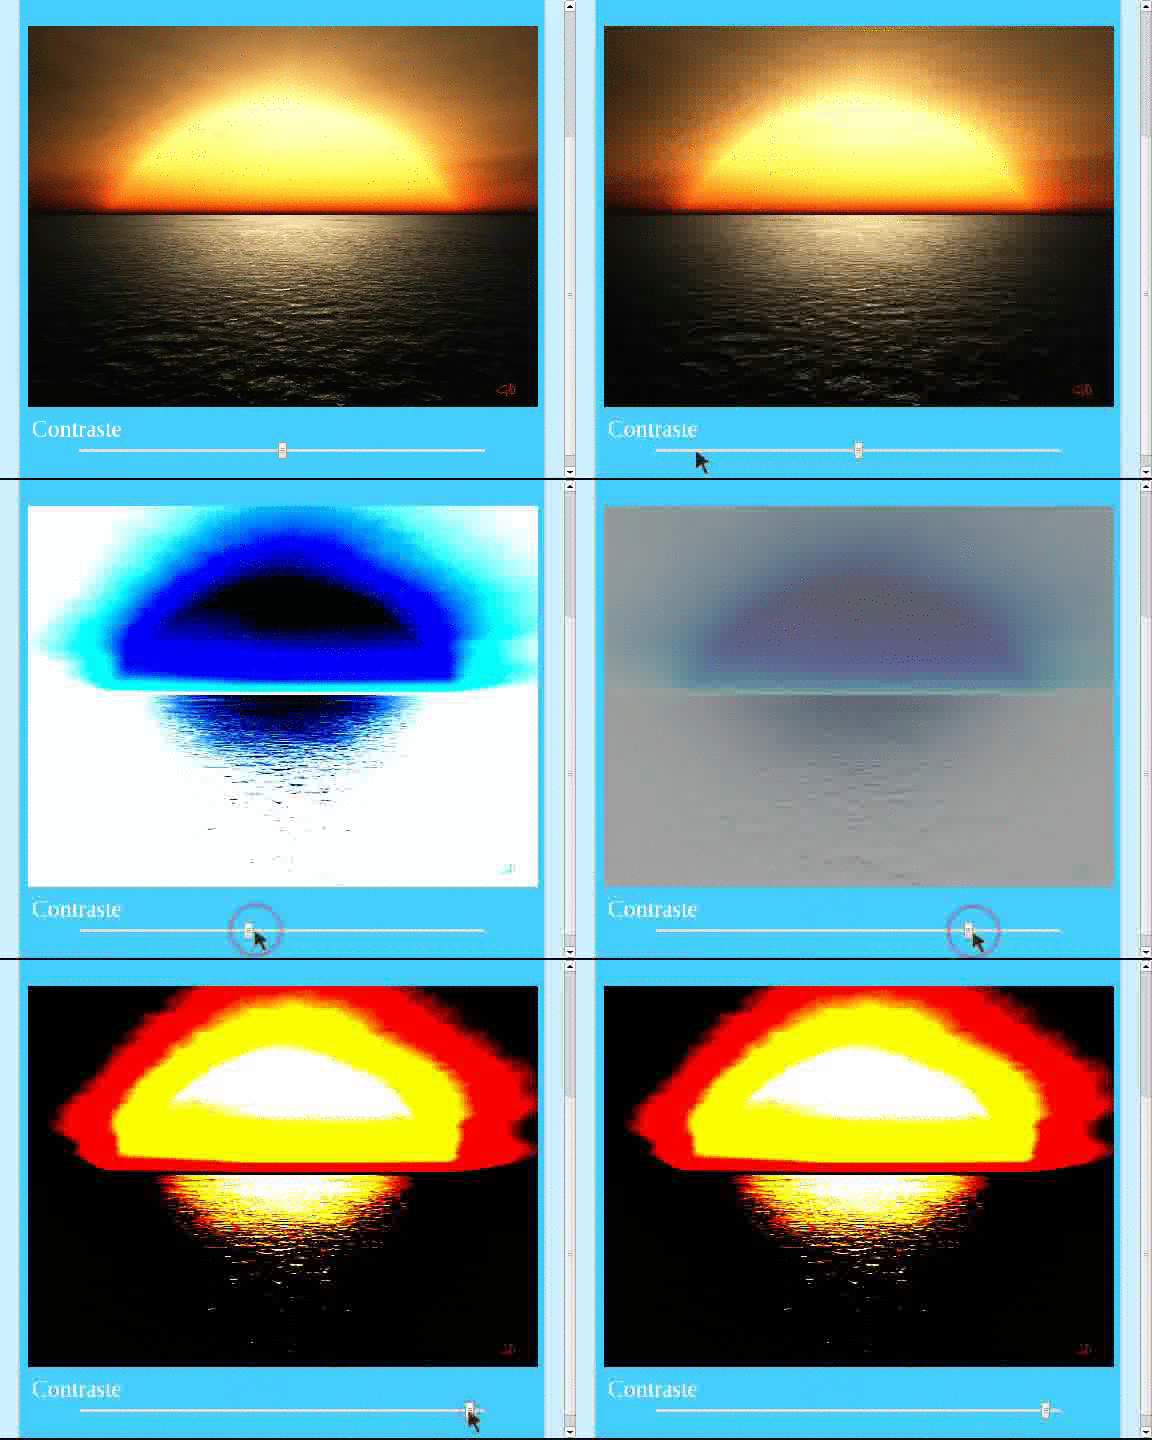
In this article, we will see how to increase or decrease the contrast of an image using HTML5 and the Canvas API; we will also briefly talk about adjusting brightness, which follows very similar logic.
Technologies and concepts we will use:
- Canvas: as a surface to draw and manipulate the image.
getImageData(): allows obtaining the data of the image drawn on the Canvas (ImageData):ImageData.width: width in pixels of theImageData.ImageData.height: height in pixels of theImageData.ImageData.resolution: pixel density of the image.ImageData.data: one-dimensional array containing pixel values in RGBA format (integers between 0 and 255). Each group of four consecutive positions represents a full pixel.img.onload: event fired when the image has completely loaded.
The contrast formula
Contrast can be defined as the variation in intensities between dark and light areas of an image, which improves focus and visual clarity. The formula applied at the pixel level is as follows:
newValue = (oldValue - 128) * tan(angle) + 128Where:
oldValue: original value of the pixel (between 0 and 255).angle: calculated asMath.tan(val * Math.PI / 180.0), where:val: value of the user-controlledrangefield (between -90 and 90 degrees).
Defining the HTML
We need a <canvas> as a drawing surface:
<canvas id="canvas">
    <p>Your browser does not support Canvas.</p>
</canvas>
And an input field of type range for the user to interactively control the contrast:
<input type="range" id="contrast" min="-90" max="90" step="5" value="0">Defining JavaScript
Global variables:
var canvas   = document.getElementById('canvas');      // canvas
var ctx      = canvas.getContext('2d');                 // context
var contrast = document.getElementById("contrast");    // input range
var srcImg   = "image.png";                            // source image
We create the Image object, set its source, and draw it on the Canvas upon loading:
img = new Image();
img.src = srcImg;
img.onload = function() {
    canvas.width  = img.width;
    canvas.height = img.height;
    ctx.drawImage(this, 0, 0);
};
The function that applies contrast:
function AddContrast(val) {
    var contrast = Math.tan(val * Math.PI / 180.0);
    canvas.width  = img.width;
    canvas.height = img.height;
    ctx.drawImage(img, 0, 0);

    var imgd = ctx.getImageData(0, 0, canvas.width, canvas.height);
    var pix  = imgd.data;

    for (var i = 0, n = pix.length; i < n; i += 4) {
        pix[i]     = rangeColor(128 + (pix[i]     - 128) * contrast); // R
        pix[i + 1] = rangeColor(128 + (pix[i + 1] - 128) * contrast); // G
        pix[i + 2] = rangeColor(128 + (pix[i + 2] - 128) * contrast); // B
    }

    ctx.putImageData(imgd, 0, 0);
}
To ensure that the resulting value for each channel does not fall outside the valid range (0–255), we use the helper function rangeColor():
function rangeColor(pix) {
    if (pix < 0)   pix = 0;
    if (pix > 255) pix = 255;
    return pix;
}
Adjusting image brightness
Adjusting brightness is even simpler: it consists of adding a constant K (in the 0–255 range) to each channel. Simply replace the contrast loop with this one:
for (var i = 0, n = pix.length; i < n; i += 4) {
    pix[i]     = rangeColor(pix[i]     + K); // R
    pix[i + 1] = rangeColor(pix[i + 1] + K); // G
    pix[i + 2] = rangeColor(pix[i + 2] + K); // B
}
The constant K can easily be obtained from a range input field:
<input type="range" id="brightness" min="0" max="255" step="1" value="0">Final Result
Experiments and more examples with Canvas
Here is a list of experiments and examples to continue exploring everything you can do with the Canvas API once you complete this guide:
- Drawing random points with Canvas
- Accessing the camera and microphone of a device with JavaScript
- How to create circle rings in JavaScript and Canvas
- Creating particles with JavaScript and Canvas
- How to create a luminous point with JavaScript and Canvas?
- How to create a wave effect with Canvas and JavaScript?
- The secret of animations in JavaScript (requestAnimationFrame())